| | Financial risk can be broken down into 3 main risk parameters: solvency risk, liquidity risk, and profitability risk. Once the amount of risk within each of these three financial risk parameters has been assessed, the overall financial risk of a farm operation can be determined. Here we will describe and measure solvency risk, the first financial risk parameter.
Solvency is defined as having enough value in the form of assets in your business to cover all of the liabilities of the business. Based on the accounting equation that assets = liabilities + equity, this definition means that a business has positive equity. When a businesses’ equity becomes negative it is said to be insolvent. Bankruptcy is just around the corner for an insolvent business if it does not generate enough cash flow income to meet its debt requirements in a timely manner.
The solvency of a business at any point in time is shown on their net worth statement. Solvency is measured from the information shown on the net worth statement. As was stated above, a farm having enough assets to cover its liabilities is solvent. The degree of solvency must be measured, as some farm businesses are more solvent than others. The degree of solvency necessary for a farm business to be successful is of paramount importance to know when assessing an agricultural operation.
The degree of solvency in a business is measured by the relationship between the assets, liabilities and equity of a business at a given point in time. By subtracting liabilities from assets you calculate the amount of equity in a business. The larger the number is for the equity amount the better off is the business. But everything is relative. Larger businesses need more equity to remain viable than does a smaller business. For this reason solvency is usually measured by ratios.
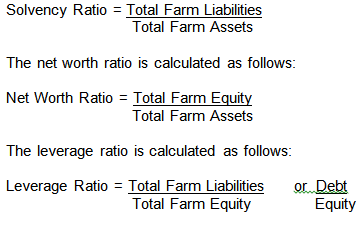
There are three main ratios used to measure solvency: the solvency ratio, the net worth ratio, and the leverage ratio. The solvency ratio is calculated as follows:

In Canada the net worth ratio and the leverage ratio are the most common ratios used to measure solvency. It is important to note that no matter which one of these ratios one uses; they are measuring exactly the same thing – the solvency of a business.
In an example say the total assets of a farm were $ 4,135,000, the total liabilities were $ 445,000, and the total equity was $ 3,690,000.
By doing a little bit of math we find that the solvency ratio is: 0.11; the net worth ratio is: 0.89; and the leverage ratio is 0.12. You will note that the solvency ratio plus the net worth ratio will equal 1 as liabilities plus equity = assets. Again, all of these ratios reveal the same degree of solvency in the farm business. But is the degree of solvency good, weak, or not good for the long- term survival of the farm?
To determine the answer to this question one must compare the solvency ratios to industry benchmarks for agriculture. Dr. David Kohl and Troy Wilson, from “Understanding Key Financial Ratios and Benchmarks” in Business Tools Bulleting from 1997, have published ratios that they feel are necessary to insure the long term survival of a farm business. Solvency ratios also depend on the type of farm enterprises one is running on their farm. Supply managed industries can carry higher financial risk and survive in the long-term as their income is secure and frequent. Thus they have less profitability risk, and can carry greater solvency risk.
The benchmarks for solvency are shown in the Benchmark Ratios Table in the ABA Template and ABA Simple Farm Ratio Analyzer. These templates automatically color ratio cells the traffic light colors of red, yellow and green, which state that the ratio at that level is high risk, medium risk, or low risk respectively.
The benchmarks for the solvency ratios are as follows:
Solvency ratio - < 0.3 is good, 0.3 – 0.45 is caution, and > 0.45 is not good
Net Worth Ratio - > 0.7 is good, 0.7 – 0.55 is caution, and < 0.55 is not good
Leverage Ratio - <0.42 is good, 0.42 – 0.82 is caution, and > 0.82 is not good
Again, all of these ratios indicate the same degree of solvency. Most financial institutions use the leverage ratio to measure solvency risk. For this reason we will use this ratio as our solvency measure. In our example above the leverage ratio is 0.12 which is “Good” or low risk because it is < 0.42. For the example above the net worth statement had a net worth ratio of 0.89, which is also very good as it is >0.7. Lower leverage ratios and higher net worth ratios mean lower solvency risk.
The farm in the example we have been following has a great leverage ratio and high net worth ratio thus low solvency risk.
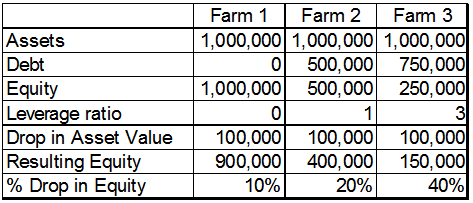
Now let’s look at another example of three similar sized farms with different levels of debt. In this example, a 10 % drop in equity, we see how quickly that farm’s solvency is affected. The same would occur if $100,000 of debt was incurred.

Such shifts would adversely affect a farms access to capital and options to continue, as illustrated in Farm 3.
As farm managers, decisions that affect solvency can severely limit a farm’s ability to operate in an efficient and profitable manner. Being in a poor solvency position during periods of adversity restricts a farm’s ability to access credit to refinance / restructure their debt and this could ultimately lead to the farm’s demise. Careful consideration must be given to the accumulation of additional debt for the purchase of land and equipment. Decreasing debt and reducing operating lines in the “good times” will create a larger equity reserve for lenders to help out a farm for emergencies or low margins in the “bad times”.
For more information
|
|